SQL trace collects information about all SQL executed by HANA Index server. It also captures any error occurred while execution, information about the database connection used and processing time information.
Requirement: You want to enable SQL trace in SAP HANA to troubleshoot some issue.
Prerequisite: You need a SAP HANA database user with system privilege TRACE ADMIN assigned.
Steps:
Requirement: You want to enable SQL trace in SAP HANA to troubleshoot some issue.
Prerequisite: You need a SAP HANA database user with system privilege TRACE ADMIN assigned.
Steps:
- Connect to the required system via HANA Studio
- Open Administration perspective, You can open it from Window > Open > Perspective > Administration Console
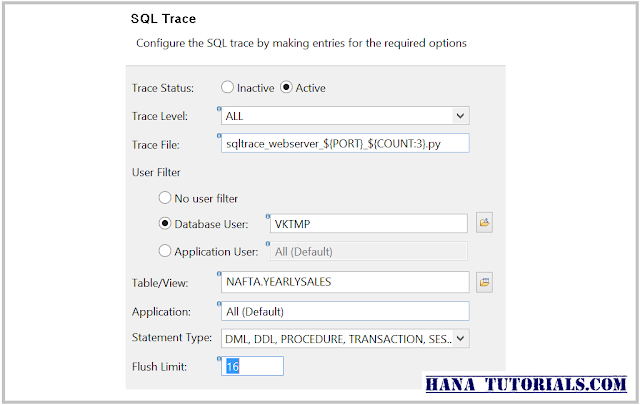
- Now go to Trace configuration and edit the 'SQL Trace' settings.
- Enter the required fields in the trace wizard , In our example we are setting up SQL trace on 'VKTMP' user and we only want SQL trace to limit on "NAFTA.YEARLYSALES" tables.
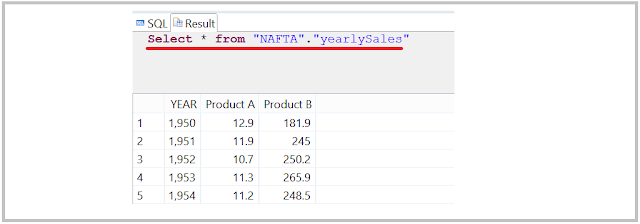
- Now we will execute following SELECT SQL for "NAFTA.YEARLYSALES" tables and it should be captured in the SQL trace.
- Once you are done with the SQL , disable(inactive) the SQL trace and got to "Diagnosis Files" to view the SQL trace file.
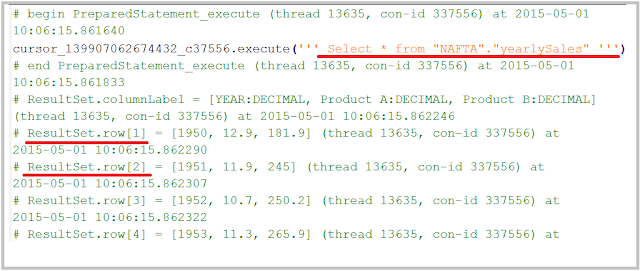
- You will see file generated with .py extension. SAP HANA stores all SQL trace file in executable python files.
- Download that file or open in HANA studio.
- In the following sample file you can see that it has captured the SQL along with the result.
Reference: http://help.sap.com/


